Observation network
Central Weather Administration Seismographic Network (CWASN)
CWB began to improve the original seismic network, the CWASN, being a modern real-time network in 1991. From the initial 19 seismic stations, 31 new stations were constructed firstly. Meanwhile, 25 existing stations of the Taiwan Telemetered Seismographic Network (TTSN), managed by the Institute of Earth Sciences of Academia Sinica, were merged into the network as well. At last, the total number of stations increased to 75 stations. At each station, three-component short-period seismograph with digital ground velocity output was installed. The data resolution was 12 bits, and the sampling rate for transmission was 100 points per second then. The acquisition method for real-time seismic data upgraded from trigger mode to continuous mode in 1994, which maintain full waveform data and improve the capabilities of small earthquakes detection. The average number of earthquakes observation a year, from 4,000, largely increased to 20,000. Since then, the Taiwan earthquake catalog has been complete maintained.
For the purpose of seismic hazards mitigation, CWB began to deploy real-time strong-motion stations in 1995. By usig the strong-motion data, source parameters of felt earthquake and seismic intensities around felt area could be evaluated automatically and directly. Consequently, greatly shorten the reporting time of felt earthquake information. Accelerographs were individual installed or co-site with existing short-period stations. The station numbers increased from 45 stations in the beginning to most 110 stations. The data resolution was 16 bits and the sampling rate is was points per second then.
After the occurrence of 1999 Chi-Chi earthquake, 24-bit high-resolution broadband seismographic stations were constructed. The sampling rate for digital ground velocity output is 100 samples per second. In comparison with the waveform data of short-period seismograph or accelerograph, the broadband seismograph record more complete frequency band of seismic data, which are very useful for seismic wave phase simulation, focal mechanism inversion, seismic moment calculation, and global earthquake observation. At that time, including 6 stations merged from the Nation Central University (NCU) broadband array, a total of 33 stations were constructed. Currently, there are 12 stations still in operation.
Since then, the complete real-time seismic network CWASN has been operating at CWB. The installed sensors in network include short-period, strong-motion, and broadband seismographs.
A progressive instrumental plan was proposed to establish the next generation seismic network of Taiwan in 2006. The project goals aimed to upgrade all existing sensors to 24-bit resolution, moreover, build up new high quality seismic stations. The advanced stations include downhole seismographic stations and cable-based OBS (Ocean Bottom Seismograph) stations. For the downhole station, one downhole broadband sensor, one downhole strong-motion sensor, and one surface strong-motion sensor are implemented at a station. Due to the practical improvements on the condition of instrument and environment, higher quality seismic data are obtained for seismological observations and researches. On the other hand, considering that 70% of big earthquakes were occurred off eastern Taiwan, which threatened to lives and properties of Taiwan seriously. Hence, the implementation of OBS stations effectively improve the capabilities of monitoring and reporting offshore big earthquakes, including shorten the earthquake response time and enhance the accuracy of focal parameters determinations.
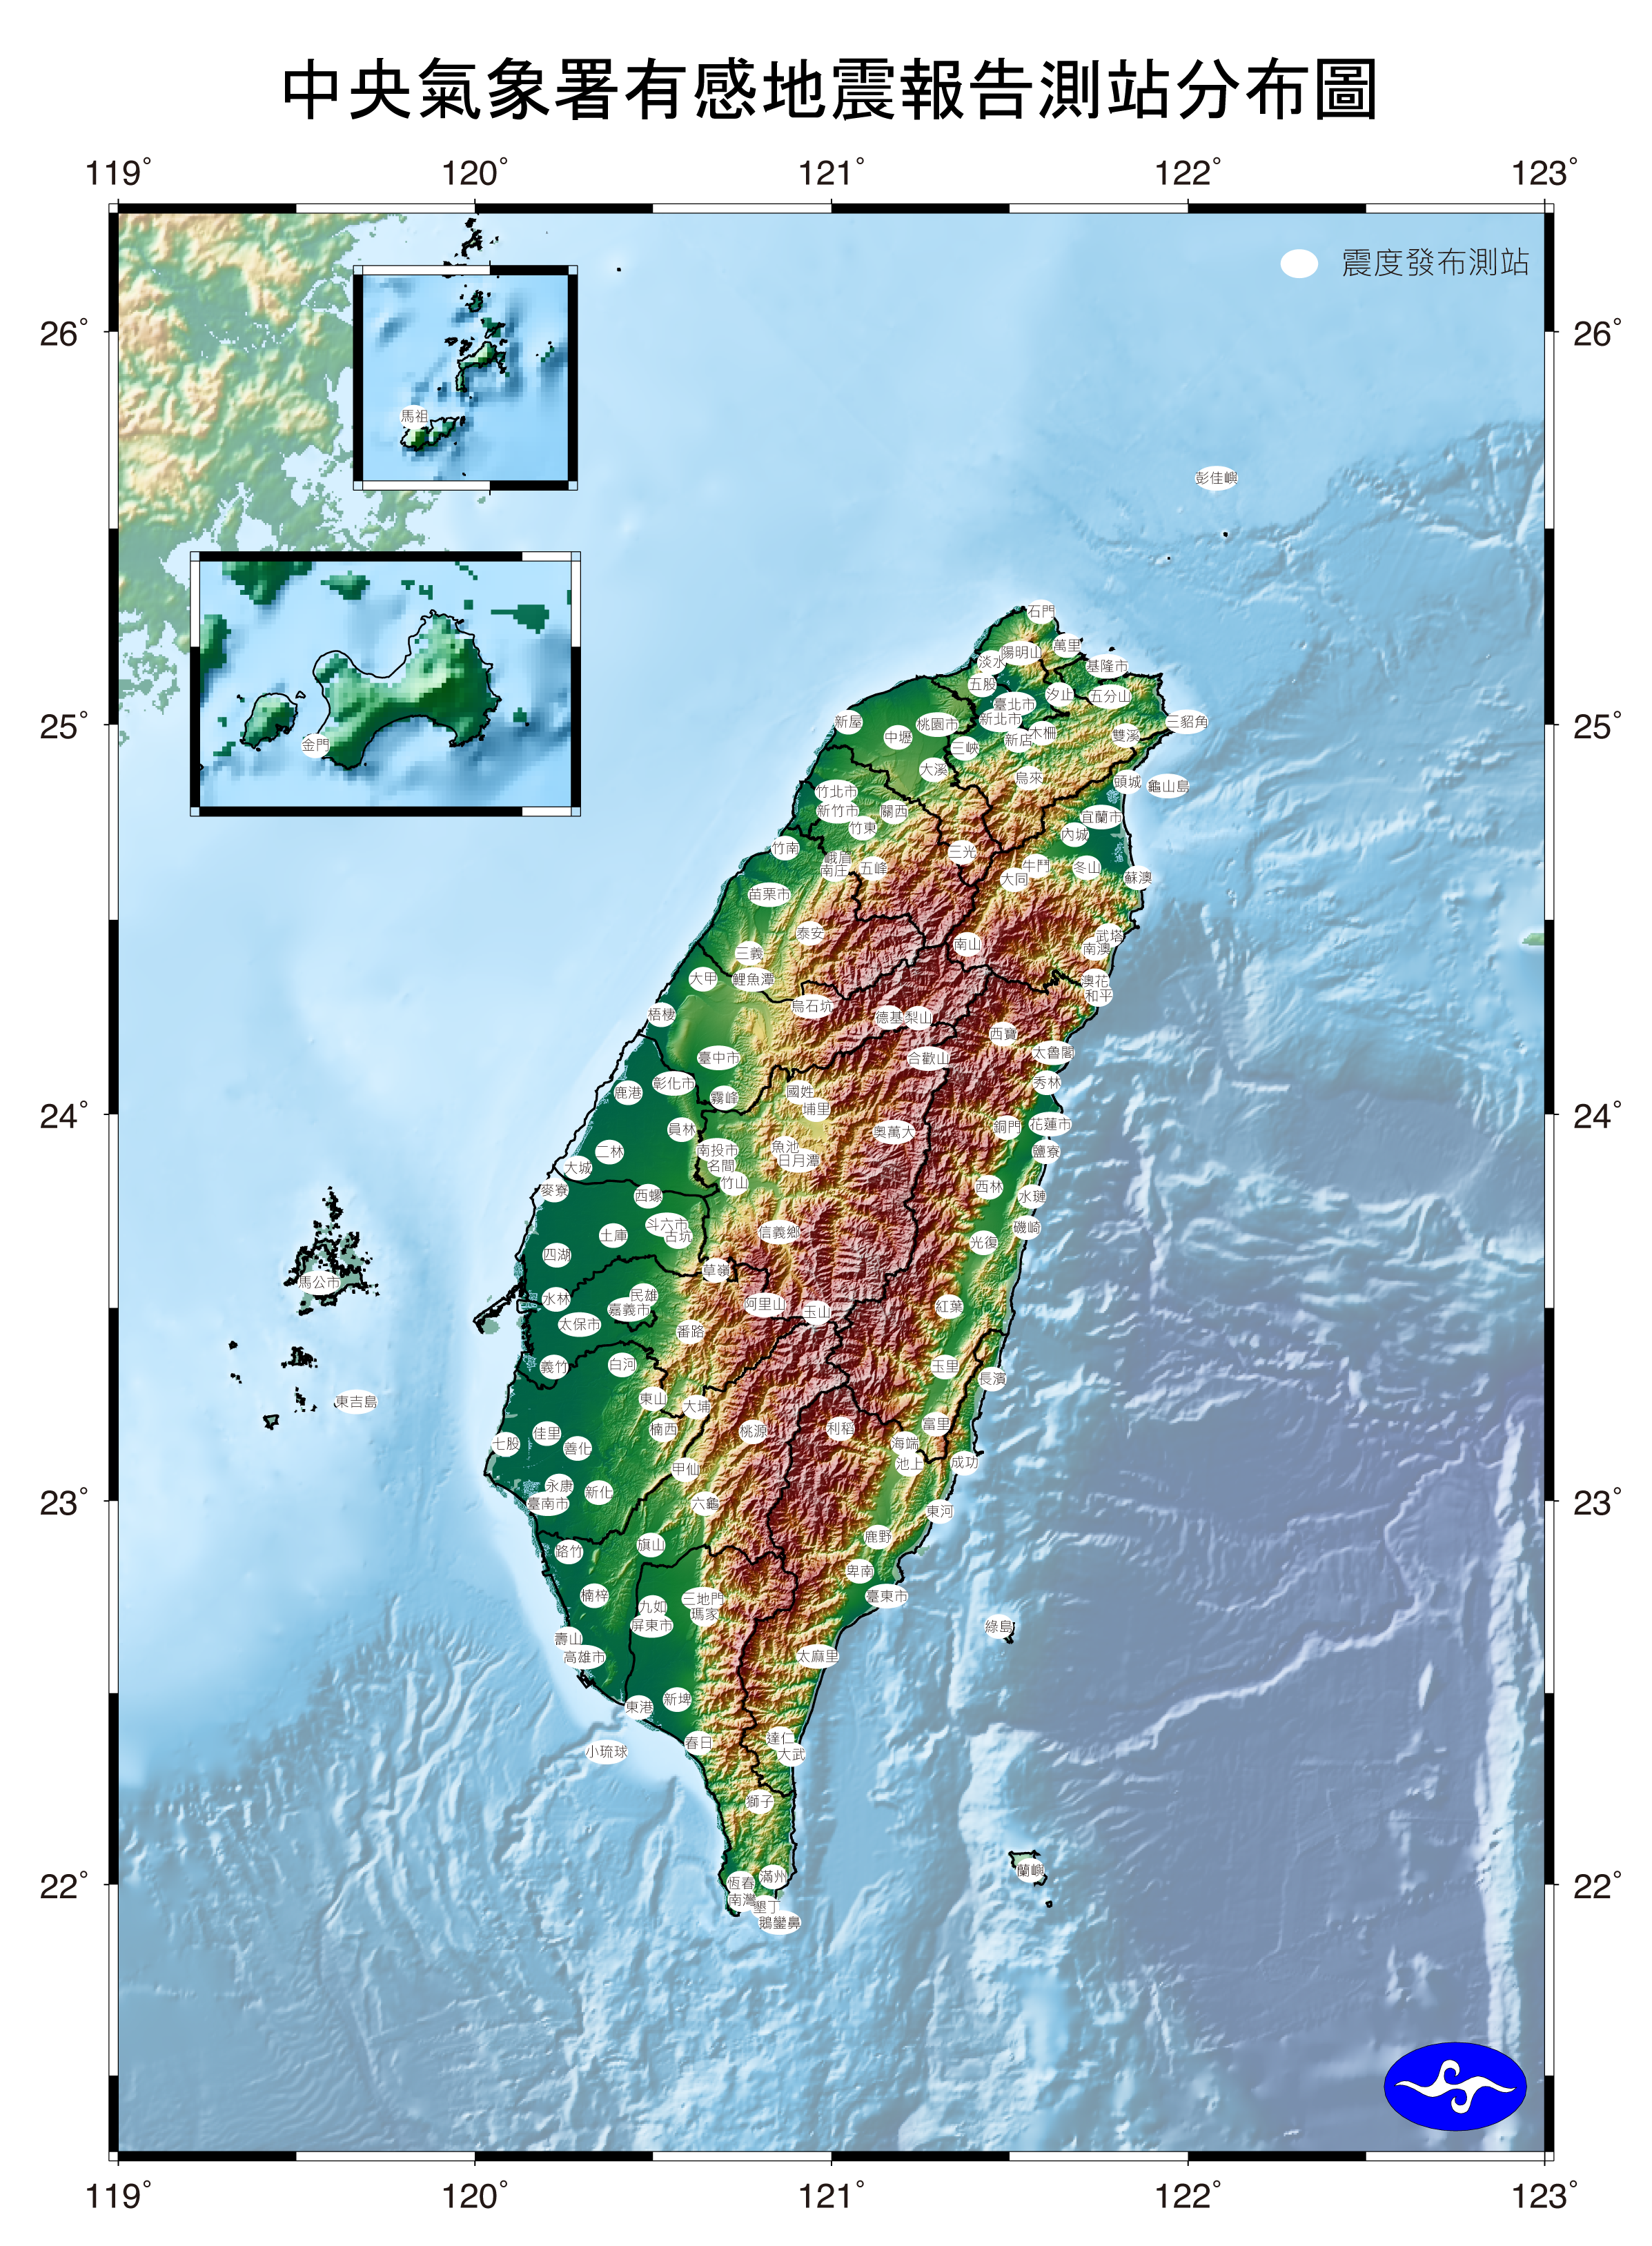
The new upgraded CWASN has been in operation since 2012. Total station sites are about 170. Short period, strong-motion, and broadband seismographs are co-site or individual installed within four different types of stations. Fig.1 shows the distribution of the observation stations. All the seismographs has been fully upgraded to 24-bit high resolution, with a sampling rate of 100 points per second. The number of earthquakes observed has significantly increased from an average of 20,000 to 40,000 per year.

Fig.1: Distribution map shows the locations of the CWASN stations.
-
- Earthquake Information
- Disastrous shocks
- Earthquake Report
- Earthquake Factsheets
-
- Tsunami
- Tsunami Information
-
- Disaster Prevention
- Precautions for Earthquake
- Precautions for Tsunami
- FAQ for Earthquake
-
- Observation network
- Observation network
- monitoring station searching

